

Lending and Mortgage news and industry updates with Crossline Capital Inc. Business Development Manager Tami Glass Fernandes
Showing posts with label loans. Show all posts
Showing posts with label loans. Show all posts
Wednesday, November 20, 2013


Thursday, August 22, 2013
| |||||||||||||||||||||||||||||||
|


 The housing sector continues to improve despite the recent rise in home loan rates, as Housing Starts rose 5.9 percent from June to July to 896,000 on an annualized basis. This was in line with estimates. Building Permits, a sign of future construction, were up 2.7 percent, coming in above expectations. In addition, the National Association of Home Builders Housing Market Index rose to 59 in August from the 57 recorded in July. This is the best level in nearly eight years.
Wednesday, August 14, 2013
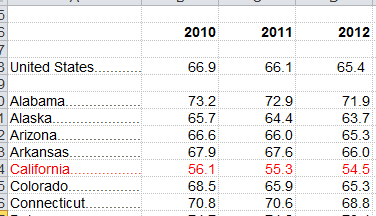
The California housing market is providing us with two different pictures. First, home prices have surged and inventory is still very low (although increasing from the spring low). However, the homeownership rate continues to decline from the peak reached in 2006 of 60.2 percent. Today the California homeownership rate is 54.5 percent. How big of a difference is this? Since 2007 California has added a net of 500,000 renter households while losing a net of 233,000 homeowners. Yet the market continues to boom in the face of a declining homeownership rate. As we look at the market today we start seeing a slowdown in the speed in which flips are being accepted and inventory is rising. With higher interest rates and the fall season just before us, will the market thaw or continue to accelerate?
Taking account
It might be useful to take into account what has occurred in the last few years in regards to the status of occupied-housing in California:

California has added a significant number of renters over this period. Many of these people lost their homes via foreclosure and simply shifted to renting their place of occupancy. What is interesting is the number of renters being added has only increased. The above data is from the Census ACS that came out in September of 2012 (the full 2012 data should be out in fall of 2013). The above figures were calculated when California had a 55.3 homeownership rate (the latest figure is 54.5 percent):

One of the big reasons for this shift has certainly come from investors purchasing homes for rent. In more typical markets, a home is sold and then another one is usually bought (two transactions are generated). In the recent market with many foreclosures, you had someone losing their home and then someone buying it from the bank (which was a one-and-done transaction if it then became a rental). This was likely the case in many areas including the Sacramento area and also the Inland Empire. I know of a few people that bought in Los Angeles and Orange County for these purposes but their rental yields were extremely low.
This trend to a lower homeownership rate is not only specific to California. It is a nationwide trend:

The homeownership rate today is back to where it was in the mid-1990s or if you go further back, to what it was in the late 1970s. In California home prices are in a manic like acceleration upwards. The median home price in the state is up a record 28.5 percent over the year:
Median price:
May 2012 $274,000
May 2013: $352,000
Home prices went up by $78,000 across the state while incomes look like this:

To put it another way, a California family would do better by simply sitting in their home generating “equity” instead of working. This is starting to sound very familiar since many of the ancillary businesses are now starting to rev up and once again have become very real estate dependent. For example, banks are living high on the hog with low rates and a continual stream of refinances. Fees and leverage allowed for record profits once again. We are even seeing a few of our favorite loans cropping up once again as well.
Yet the change in California is symbolic of a bigger trend nationwide. Fewer and fewer people will be able to live what they think of as a middle class lifestyle in more expensive regions. And the legions of poor are also growing. In 2008, California had 2,220,127 people of food assistance. Today it is closer to 4,000,000 (a jump of 80 percent in roughly four years). This is in the same state that saw an overall median price jump of 28.5 percent.
The unsold inventory index is down to around 2.9 months which indicates tight conditions for anyone looking to buy. While the talk is heating up, the facts show that hundreds of thousands of Californians have now become renters versus homeowners. A few open houses seemed a bit calmer this month but only by a little.
What are you seeing in your local real estate market?
Taking account
It might be useful to take into account what has occurred in the last few years in regards to the status of occupied-housing in California:
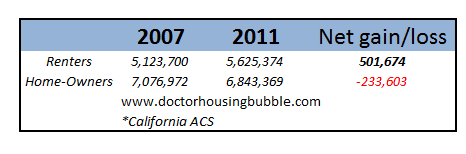
California has added a significant number of renters over this period. Many of these people lost their homes via foreclosure and simply shifted to renting their place of occupancy. What is interesting is the number of renters being added has only increased. The above data is from the Census ACS that came out in September of 2012 (the full 2012 data should be out in fall of 2013). The above figures were calculated when California had a 55.3 homeownership rate (the latest figure is 54.5 percent):
One of the big reasons for this shift has certainly come from investors purchasing homes for rent. In more typical markets, a home is sold and then another one is usually bought (two transactions are generated). In the recent market with many foreclosures, you had someone losing their home and then someone buying it from the bank (which was a one-and-done transaction if it then became a rental). This was likely the case in many areas including the Sacramento area and also the Inland Empire. I know of a few people that bought in Los Angeles and Orange County for these purposes but their rental yields were extremely low.
This trend to a lower homeownership rate is not only specific to California. It is a nationwide trend:
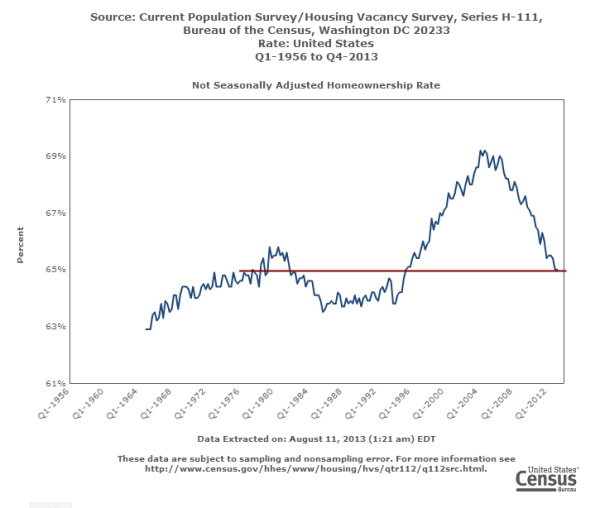
The homeownership rate today is back to where it was in the mid-1990s or if you go further back, to what it was in the late 1970s. In California home prices are in a manic like acceleration upwards. The median home price in the state is up a record 28.5 percent over the year:
Median price:
May 2012 $274,000
May 2013: $352,000
Home prices went up by $78,000 across the state while incomes look like this:
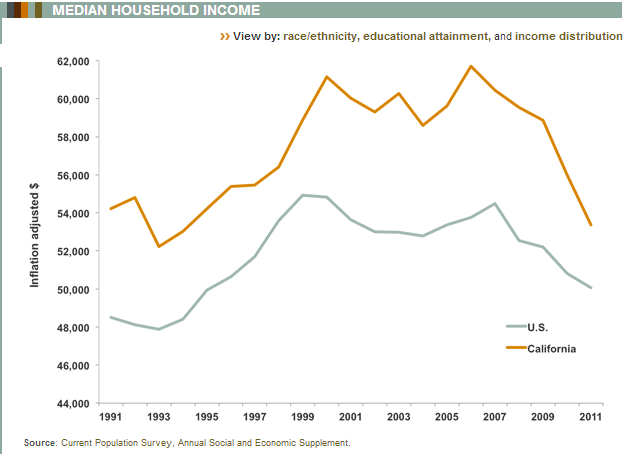
To put it another way, a California family would do better by simply sitting in their home generating “equity” instead of working. This is starting to sound very familiar since many of the ancillary businesses are now starting to rev up and once again have become very real estate dependent. For example, banks are living high on the hog with low rates and a continual stream of refinances. Fees and leverage allowed for record profits once again. We are even seeing a few of our favorite loans cropping up once again as well.
Yet the change in California is symbolic of a bigger trend nationwide. Fewer and fewer people will be able to live what they think of as a middle class lifestyle in more expensive regions. And the legions of poor are also growing. In 2008, California had 2,220,127 people of food assistance. Today it is closer to 4,000,000 (a jump of 80 percent in roughly four years). This is in the same state that saw an overall median price jump of 28.5 percent.
The unsold inventory index is down to around 2.9 months which indicates tight conditions for anyone looking to buy. While the talk is heating up, the facts show that hundreds of thousands of Californians have now become renters versus homeowners. A few open houses seemed a bit calmer this month but only by a little.
What are you seeing in your local real estate market?
Subscribe to:
Posts (Atom)